Troubleshooting ELK
Here’s what I’ve been trying and how I’ve been failing for a whole week.
Initial setup
I first start by generating a CA, and a certificate for the elasticsearch & fleet server:
# CA
openssl genrsa -out ca.key 2048
openssl req -x509 -new -nodes -key ca.key -sha256 -days 365 -out ca.crt

# elasticsearch
openssl genrsa -out elasticsearch.key 2048
openssl req -new -key elasticsearch.key -out elasticsearch.csr -config elasticsearch.cnf
openssl x509 -req -in elasticsearch.csr -CA ca.crt -CAkey ca.key -CAcreateserial -out elasticsearch.crt -days 365 -sha256 -extfile elasticsearch.cnf -extensions v3_req
openssl verify -CAfile ca.crt elasticsearch.crt # OK

# fleet-server
openssl genrsa -out fleet-server.key 2048
openssl req -new -key fleet-server.key -out fleet-server.csr -config fleet-server.cnf
openssl x509 -req -in fleet-server.csr -CA ca.crt -CAkey ca.key -CAcreateserial -out fleet-server.crt -days 365 -sha256 -extfile fleet-server.cnf -extensions v3_req
openssl verify -CAfile ca.crt fleet-server.crt # OK
Then I used this docker-compose.yml to set everything up:
version: '3'
services:
  elasticsearch:
    image: elasticsearch:8.16.2
    container_name: elasticsearch
    environment:
      - node.name=elasticsearch
      - cluster.initial_master_nodes=elasticsearch
      - xpack.security.enabled=true
      - xpack.security.transport.ssl.enabled=true
      - xpack.security.transport.ssl.key=/usr/share/elasticsearch/config/certs/elasticsearch.key
      - xpack.security.transport.ssl.certificate=/usr/share/elasticsearch/config/certs/elasticsearch.crt
      - xpack.security.transport.ssl.verification_mode=certificate
      - xpack.security.http.ssl.enabled=true
      - xpack.security.http.ssl.key=/usr/share/elasticsearch/config/certs/elasticsearch.key
      - xpack.security.http.ssl.certificate=/usr/share/elasticsearch/config/certs/elasticsearch.crt
      - xpack.security.http.ssl.certificate_authorities=/usr/share/elasticsearch/config/certs/ca.crt
      - xpack.security.http.ssl.verification_mode=certificate
    volumes:
      - /path/to/elk/certs:/usr/share/elasticsearch/config/certs
      - /path/to/elk/elasticsearch.yml:/usr/share/elasticsearch/config/elasticsearch.yml
    ports:
      - "9200:9200"
      - "9300:9300"
    networks:
      - noirnet

  kibana:
    image: kibana:8.16.2
    container_name: kibana
    environment:
      ELASTICSEARCH_URL: https://x.x.x.x:9200
      ELASTICSEARCH_SSL_VERIFICATION_MODE: certificate
      ELASTICSEARCH_SSL_CACERT: /usr/share/kibana/config/certs/ca.crt
    volumes:
      - /path/to/elk/certs:/usr/share/kibana/config/certs
      - /path/to/elk/kibana.yml:/usr/share/kibana/config/kibana.yml
    ports:
      - "5601:5601"
    depends_on:
      - elasticsearch
    networks:
      - noirnet

networks:
  noirnet:
Here’s the configs for elasticsearch.yml & kibana.yml:
# ======================== Elasticsearch Configuration =========================
cluster.name: "docker-cluster"
network.host: 0.0.0.0
# ======================== Kibana Configuration =========================
elasticsearch.hosts: ["https://x.x.x.x:9200"]
elasticsearch.serviceAccountToken: "AAEAAWVsYXN0aWMva2liYW5hL2tpYmFuYS10b2tlbjptTExrN3F0a1RMU3c0ZHY4a2RUTzF3"
# SSL settings
elasticsearch.ssl.verificationMode: certificate
elasticsearch.ssl.certificateAuthorities: "/usr/share/kibana/config/certs/ca.crt"
elasticsearch.ssl.certificate: "/usr/share/kibana/config/certs/elasticsearch.crt"
elasticsearch.ssl.key: "/usr/share/kibana/config/certs/elasticsearch.key"
# Kibana server settings
server.port: 5601
server.host: "0.0.0.0"After this I start the containers with sudo docker compose up -d, I then use a script to reset the elastic user’s password and to get a service account token for my kibana.yml.
#!/usr/bin/env bash

# Get the elastic user password
echo "Getting the elastic user password..."
sudo docker exec -it elasticsearch elasticsearch-reset-password -u elastic

# Get the kibana enrollment token
echo ""
echo "Getting the kibana service token..."
sudo docker exec -it elasticsearch elasticsearch-service-tokens create elastic/kibana kibana-token
After adding this account service token to my kibana.yml I restart the container with sudo docker restart kibana
At this point everything is connected and I can login, via the web portal.
Fleet server install
After logging in with the elastic account and my brand new password, I go to my fleet in the kibana GUI. I go to add a fleet server in the advanced tab so that I’m able to use my own certificates, this is where I get the service token as well.
sudo ./elastic-agent install --url=https://x.x.x.x:8220
--fleet-server-es=https://x.x.x.x:9200
--fleet-server-service-token=AAEAAWVsYXN0aWMvZmxlZXQtc2VydmVyL3Rva2VuLTE3MzY0Mjg0MTg0MDY6MXl6M2gtSVFUY0dMZXh3dnlJT2VnZw
--fleet-server-policy=fleet-server-policy
--certificate-authorities=/path/to/elastic-agent-8.16.2-linux-x86_64/certs/ca.crt
--fleet-server-es-ca=/path/to/elastic-agent-8.16.2-linux-x86_64/certs/elasticsearch.crt
--fleet-server-cert=/path/to/elastic-agent-8.16.2-linux-x86_64/certs/fleet-server.crt
--fleet-server-cert-key=/path/to/elastic-agent-8.16.2-linux-x86_64/certs/fleet-server.key
--fleet-server-port=8220
Agent install
Services token is generated from the GUI btw
sudo ./elastic-agent install
--url=https://x.x.x.x:8220
--enrollment-token=czcwd1M1UUI2ZWFnNlg3Sk96VlI6OWxKUFE2VHRUQ0dkRkJwQmNMdGNOQQ==
--certificate-authorities=/path/to/elastic-agent-8.16.2-linux-x86_64/certs/ca.crt
--fleet-server-es-ca=/path/to/elastic-agent-8.16.2-linux-x86_64/certs/elasticsearch.crt
Where problems start
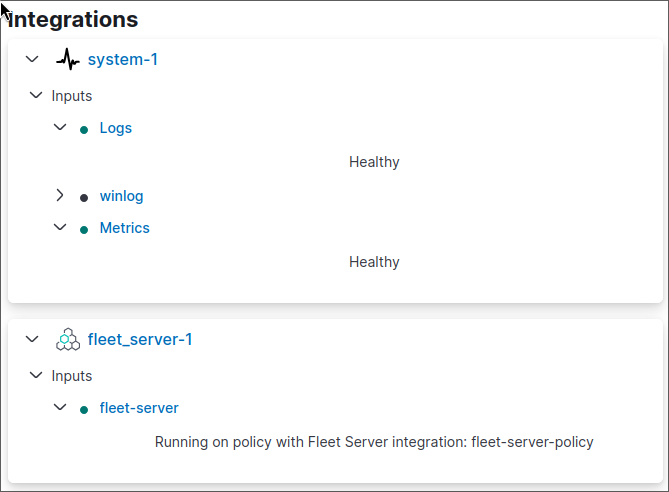
I get a successful connection from both my fleet server and the subsequent agent on another machine.
[!NOTE] All servers i.e. elasticsearch, kibana, fleet server are running at the same IP.
However my fleet server, despite appearing as healthy. Doesn’t send any logs as evidenced by these screenshots:

A sinister agent
On my agent I have something a bit more sinister happening:

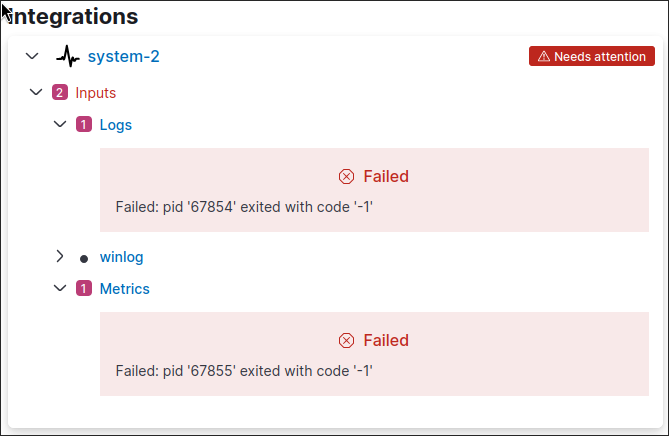
The logs don’t seem very helpful either (I personally can’t make sense of them):
After running sudo elastic-agent status I get this:
┌─ fleet
│  └─ status: (HEALTHY) Connected
└─ elastic-agent
   ├─ status: (DEGRADED) 1 or more components/units in a failed state
   ├─ log-default
   │  ├─ status: (FAILED) Failed: pid '68906' exited with code '-1'
   │  ├─ log-default
   │  │  └─ status: (FAILED) Failed: pid '68906' exited with code '-1'
   │  └─ log-default-logfile-system-63245089-fa52-4085-aea4-73baa31afa13
   │     └─ status: (FAILED) Failed: pid '68906' exited with code '-1'
   └─ system/metrics-default
      ├─ status: (FAILED) Failed: pid '68907' exited with code '-1'
      ├─ system/metrics-default
      │  └─ status: (FAILED) Failed: pid '68907' exited with code '-1'
      └─ system/metrics-default-system/metrics-system-63245089-fa52-4085-aea4-73baa31afa13
         └─ status: (FAILED) Failed: pid '68907' exited with code '-1'
And here’s an example log entry (they all look the same):
{"log.level":"error","@timestamp":"2025-01-09T15:42:13.895Z","log.origin":{"function":"github.com/elastic/elastic-agent/internal/pkg/agent/application/coordinator.(*Coordinator).watchRuntimeComponents","file.name":"coordinator/coordinator.go","file.line":663},"message":"Unit state changed log-default (STARTING->FAILED): Failed: pid '69668' exited with code '-1'","log":{"source":"elastic-agent"},"component":{"id":"log-default","state":"FAILED"},"unit":{"id":"log-default","type":"output","state":"FAILED","old_state":"STARTING"},"ecs.version":"1.6.0"}Voila this is all I have so far, from what I can gather. The installation is succesful in terms of connecting all the services together, and I’m experiencing issues locally. The machines are having problems with the processes that are supposed to send the logs.